SKYCROSS
An atmospheric monitoring terminal for tracking route risk, infrastructure status, and network activity across a fictional transit system.
ROLE
UI / Product / Motion Design
TOOLS
Figma / Framer
FOCUS
Map interaction & status systems
SCOPE
Infrastructure monitoring terminal
CONSTRAINTS
Balancing atmosphere with readability

Project Framing
Skycross is an archive terminal used by operators to inspect atmospheric infrastructure, monitor unstable routes, and respond to fauna/activity risks.
Problem
Skycross needed to feel like a believable terminal while still functioning as a usable monitoring interface.
The core challenge was balancing atmosphere, diegetic storytelling, and system data with clear interaction, readable states, and fast user comprehension.
Constraints
The interface needed to remain atmospheric without becoming unreadable.Map states, detail panels, and archive pages had to feel like one connected system.
Design Goals
Make infrastructure status and route risk quickly scannable.Build a coherent archive system across map, records, and supporting pages.
System Logic
Infrastructure Map
The core system is the infrastructure map. Nodes, routes, activity layers, and status states work together to help the operator assess local network risk.
Select Layer
ChooseTelemetry,Routes, orFauna.Read Map
Assess nodes, routes, warnings, and activity.Select Node
Click a regulator/node to inspect it.Inspect Detail
Read operational data in the side panel.Open Record
Move into supporting archive pages.

System Elements
Nodes
Nodes represent infrastructure points. Shape identifies node type, while colour and selection states communicate operational condition.

Nexus

Regulator
Inactive


Sub-structure
Routes
Routes communicate transit stability and risk through opacity, colour, and line style.
Sky Rail
Stable
Unstable
Critical
Status States
Status states standardise risk feedback across nodes, routes, alerts, and selected detail views.
operational
Critical
Caution
Neutral / no data
Node selected
Interface Decisions
Map-first hierarchy
The map stays visually dominant so the operator can assess network status before reading detailed records.
Secondary metadata is pushed into panels and supporting archive pages.
Routes activity
layer selected

2 - Progressive disclosure
Detailed operational data only appears after node selection, reducing information density while keeping the system inspectable.
Default

Selected

Atmosphere vs
readability
The interface uses diegetic language, soft atmospheric textures, and low-contrast metadata, but key states remain standardised through colour, symbols, and repeated panel structure.

Interaction & Motion
Layer Switching
The map switches between telemetry, routes, and fauna activity without changing context. This lets the operator compare different risk layers while remaining on the infrastructure map.
TelemetryLive meters provide the operator a quick read of infrastructure status and atmospheric stability.
RoutesTransit paths fade into view with reduced opacity, revealing route stability and critical crossing conditions.
FaunaThe map scale shifts toward threat activity. Animated traces move across local areas, showing projected fauna movement.
Node Feedback
Hover and press states make infrastructure points feel inspectable before selection.
Detail Disclosure
Selecting a node moves attention from the map to the detail panel. The selected ring, panel update, and status data appear together so the operator understands which object is being inspected.
Supporting Records
The map sits inside a wider archive system. Supporting pages extend the same operational language into communication records, habitation data, and incident history.
Archive System
The map sits inside a wider archive system. Supporting pages extend the same operational language into communication records, habitation data, and incident history.
Archive Home
The map is framed by objective text, live metadata, and archive navigation.

Communion Records
Communication entries are organised as active and discontinued records.


Habitation Zones
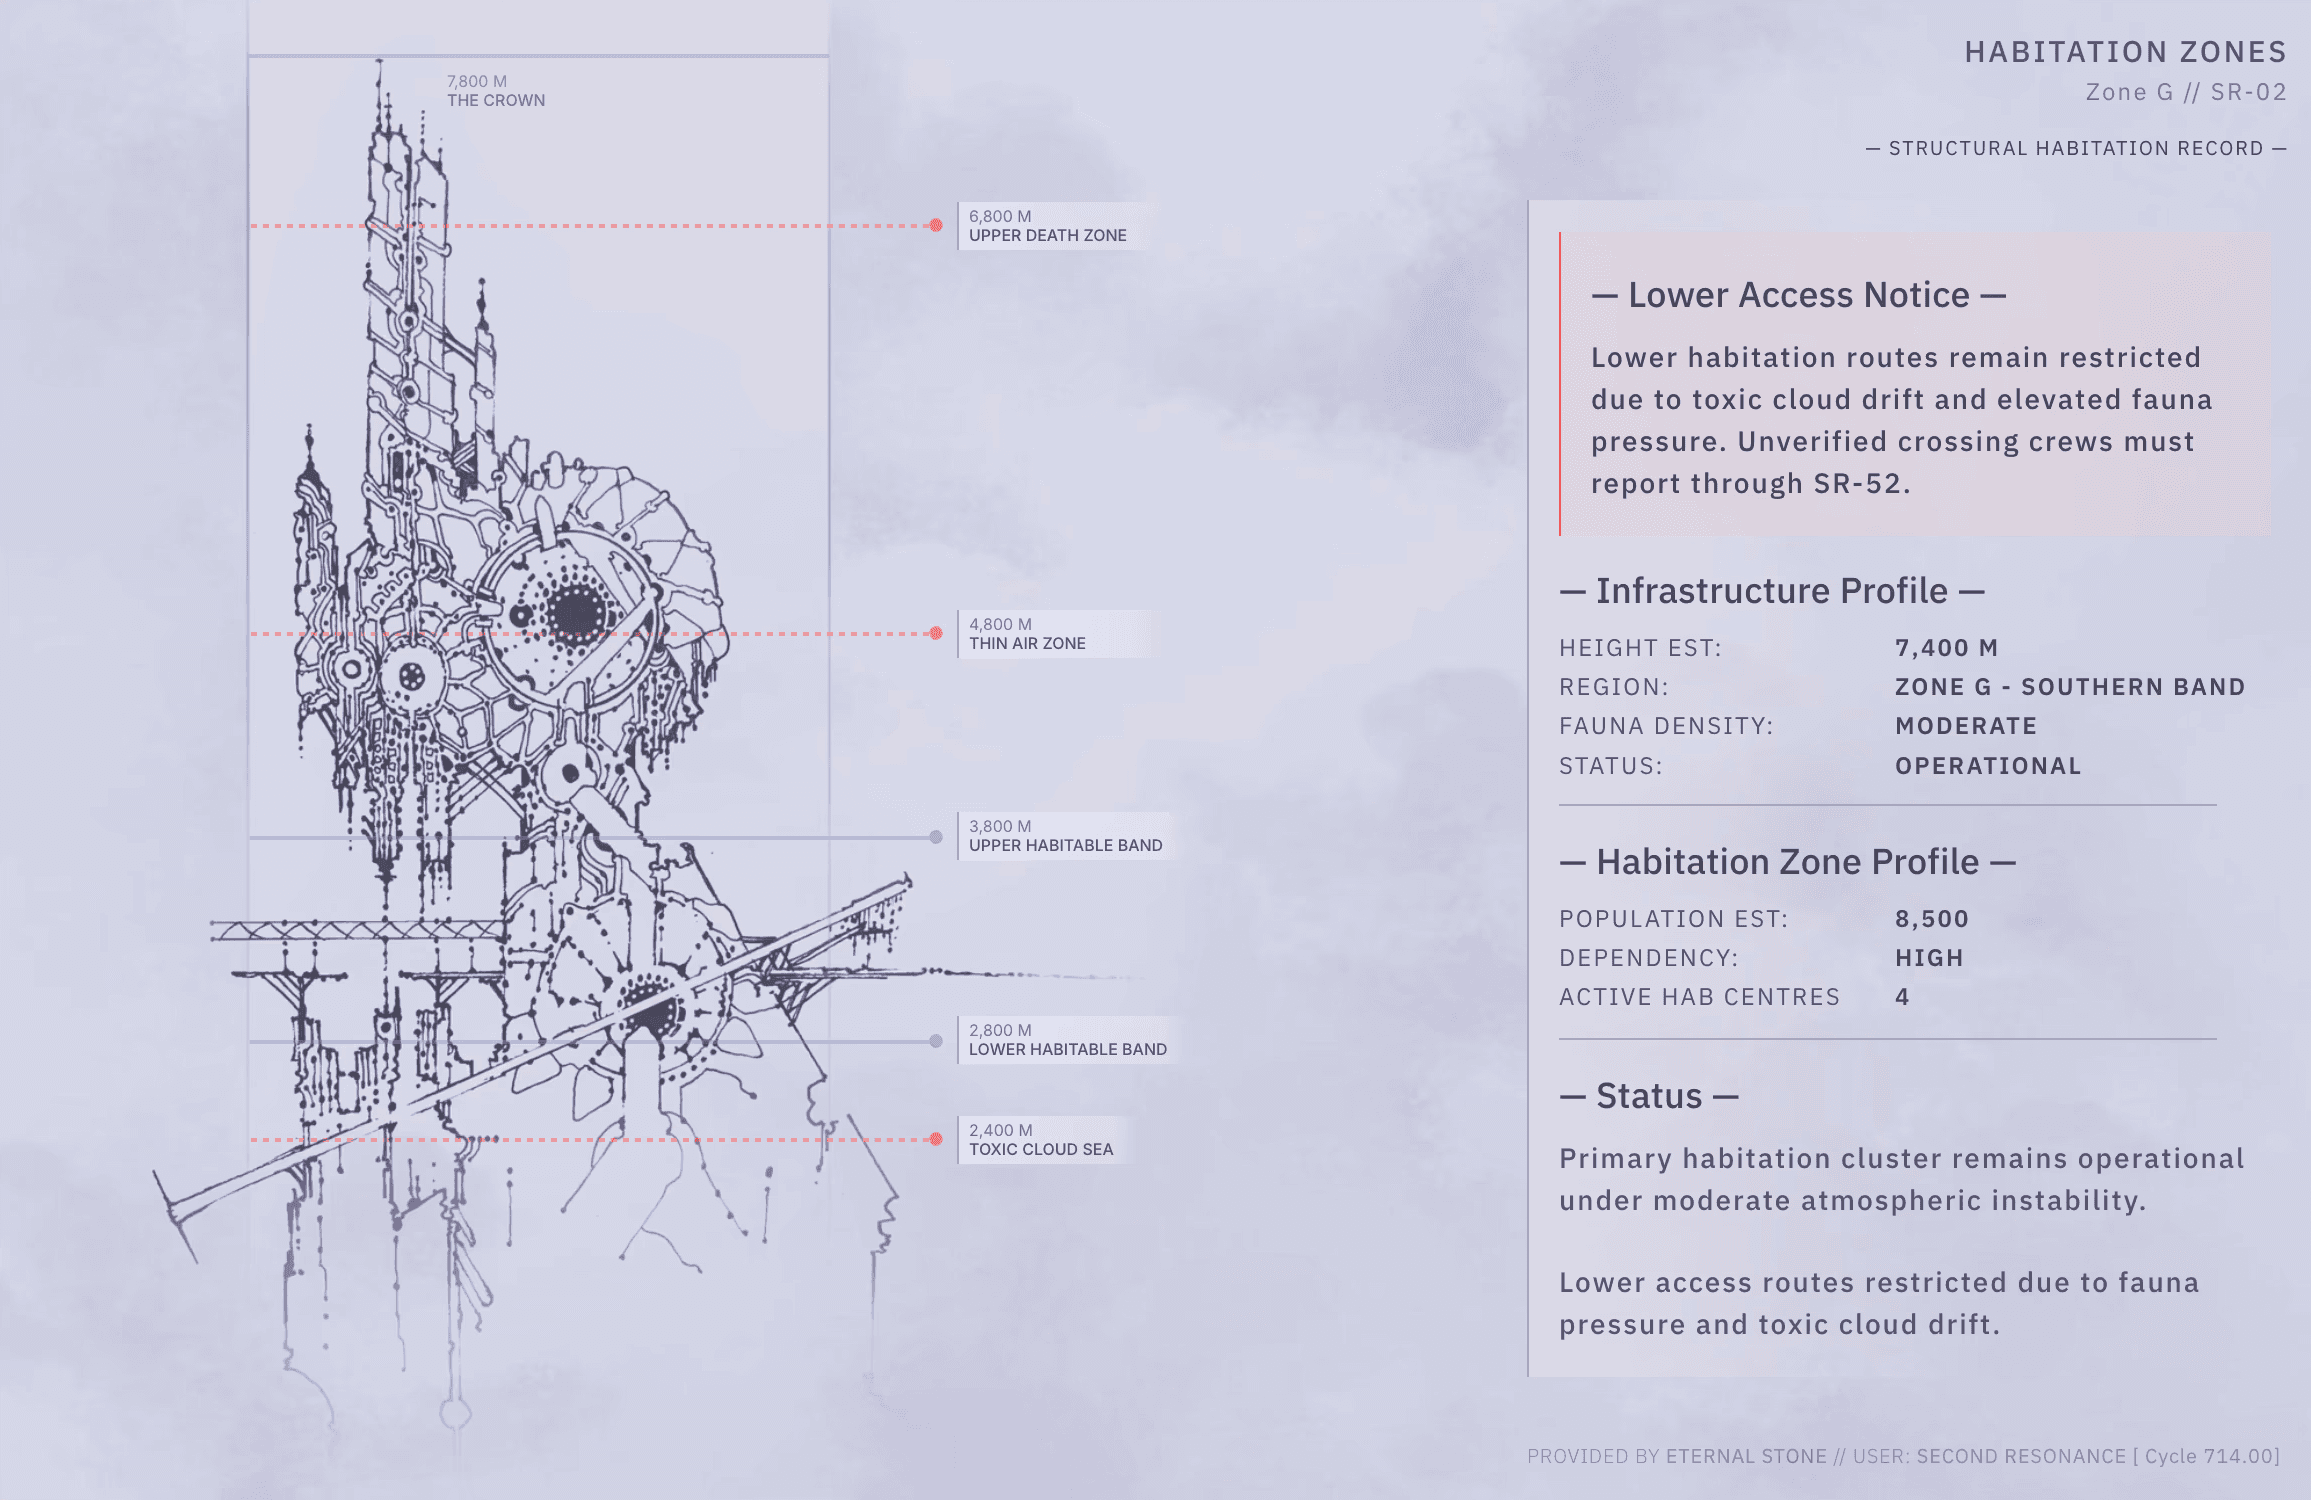
Population and infrastructure data are presented as operational records.

Overseer Log
Incidents are tracked through category states and severity feedback.

System Robustness
Mobile Fallback
The mobile version prioritises access to records and static map context rather than recreating the full desktop interaction model.
Mobile Map Fallback
The desktop map is reduced to a static overview on mobile, preserving spatial context while prioritising access to records and navigation.

Habitation View ModesThe habitation page uses simple view states to separate structural imagery from altitude information.

Design Trade-offs
Approach
Map-first interaction model.Diegetic archive language with functional UI structure.
Decisions
Kept the infrastructure map as the primary surface so operators can assess network risk before opening records.Standardised status language across nodes, routes, alerts, cards, and archive pages.Used motion to confirm layer changes, node inspection, and record interaction rather than adding decorative animation.
Trade-offs
Reduced visual contrast in secondary metadata to preserve atmosphere, while keeping critical states colour-coded.Prioritised desktop interaction for the full map system, with mobile acting as a simplified fallback.
Outcomes and
Reflection
Outcome
Skycross became a coherent monitoring system rather than a collection of atmospheric screens.
The final interface connects map interaction, status logic, archive records, and motion feedback into one consistent operator experience.
Future Improvements
Validate the map interaction with external users to test whether the layer system, node states, and archive navigation are immediately understood.Improve mobile by designing a more purpose-built archive experience rather than relying on a simplified fallback.
Reflection
This project pushed me to design beyond isolated screens. I had to think in interaction states, hierarchy, accessibility, motion behaviour, and system consistency.
The strongest lesson was learning where atmosphere supports usability, and where it needs to be restrained.
SKYCROSS
A self-led product designed to track route risk, infrastructure status, and network activity across a fictional transit system.

ROLE
UI / Product / Motion Design
TOOLS
Figma / Framer
FOCUS
Map interaction & status systems
SCOPE
Fictional infrastructure monitoring terminal
CONSTRAINTS
Balancing atmosphere with readability
Project Framing
Skycross is an archive terminal used by operators to inspect atmospheric infrastructure, monitor unstable routes, and respond to fauna/activity risks.
Problem
Skycross needed to feel like a believable terminal while still functioning as a usable monitoring interface.
The core challenge was balancing atmosphere, diegetic storytelling, and system data with clear interaction, readable states, and fast user comprehension.
Constraints
The interface needed to remain atmospheric without becoming unreadable.Map states, detail panels, and archive pages had to feel like one connected system.Mobile needed to preserve access without forcing the full interactive map into a small viewport.
Design Goals
Make infrastructure status and route risk quickly scannable.Use interaction states to reveal detail only when needed.Build a coherent archive system across map, records, and supporting pages.
System Logic
Infrastructure Map
The core system is the infrastructure map. Nodes, routes, activity layers, and status states work together to help the operator assess local network risk.
Select Layer
ChooseTelemetry,Routes, orFauna.Read Map
Assess nodes, routes, warnings, and activity.Select Node
Click a regulator/node to inspect it.Inspect Detail
Read operational data in the side panel.Open Record
Move into supporting archive pages.
System Elements
Nodes
Nodes represent infrastructure points. Shape identifies node type, while colour and selection states communicate operational condition.
Nexus
Regulator
Inactive
Sub-structure
Routes
Routes communicate transit stability and risk through opacity, colour, and line style.
Sky Rail
Stable
Unstable
Critical
Activity Layers
Activity layers let the operator switch between telemetry, route stability, and fauna activity without leaving the map.
Status States
Status states standardise risk feedback across nodes, routes, alerts, and selected detail views.
operational
Critical
Caution
Neutral / no data
Node selected
Interface Decisions
Map-first hierarchy
The map stays visually dominant so the operator can assess network status before reading detailed records.
Secondary metadata is pushed into panels and supporting archive pages.
Routes activity
layer selected

Progressive disclosure
Detailed operational data only appears after node selection, reducing information density while keeping the system inspectable.
Default
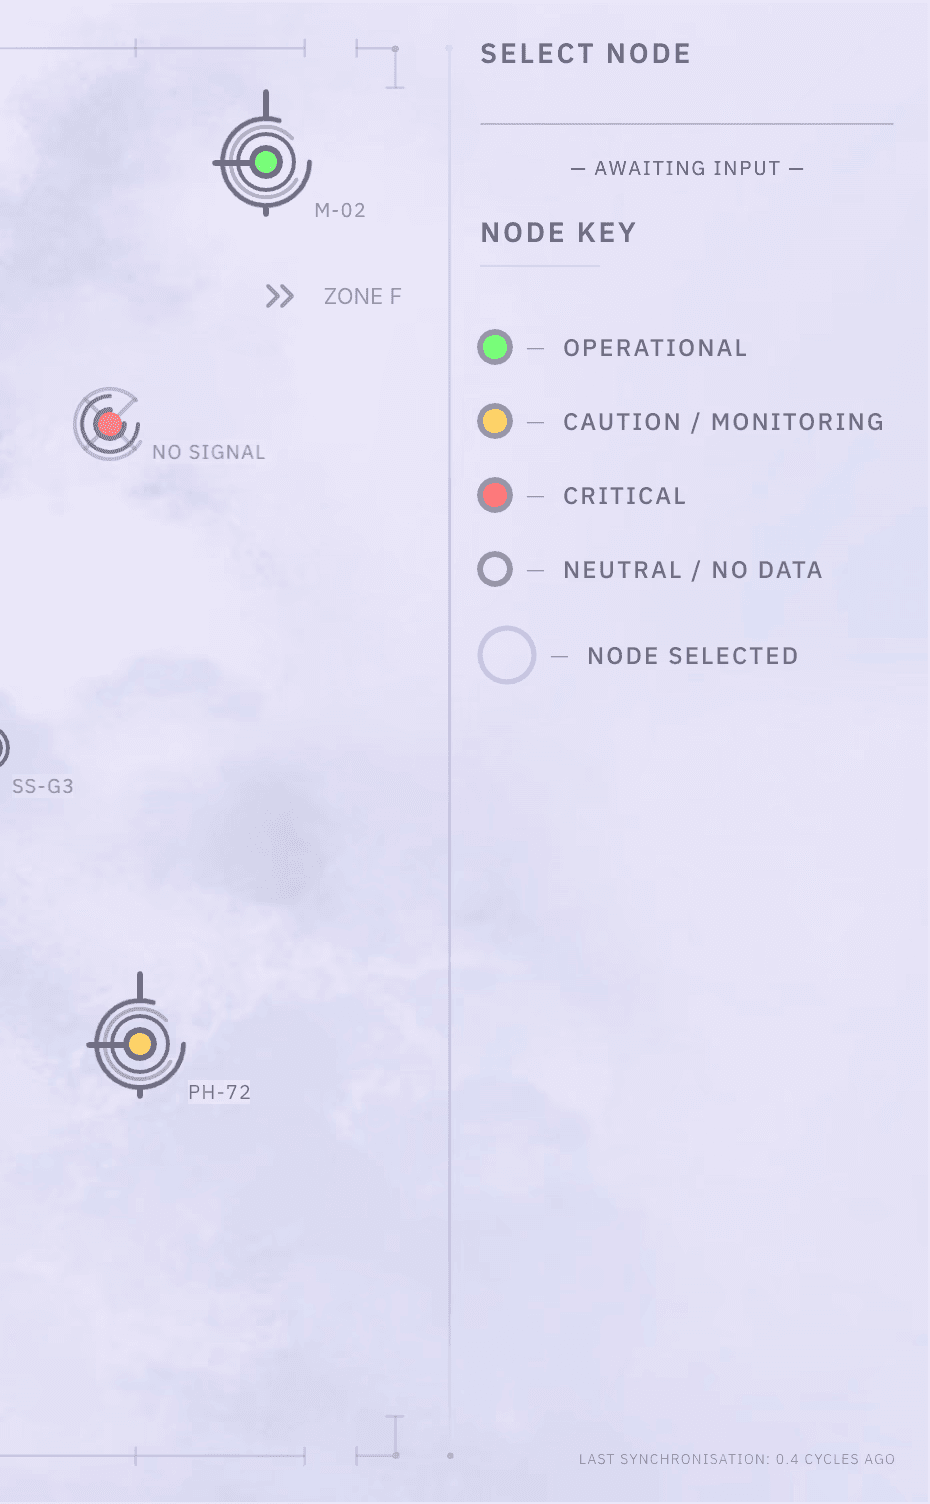
Selected

Atmosphere vs readability
The interface uses diegetic language, soft atmospheric textures, and low-contrast metadata, but key states remain standardised through colour, symbols, and repeated panel structure.
Interaction & Motion
Layer Switching
The map switches between telemetry, routes, and fauna activity without changing context. This lets the operator compare different risk layers while remaining on the infrastructure map.
TelemetryLive meters provide the operator a quick read of infrastructure status and atmospheric stability.
RoutesTransit paths fade into view with reduced opacity, revealing route stability and critical crossing conditions.
FaunaThe map scale shifts toward threat activity. Animated traces move across local areas, showing projected fauna movement and route pressure.
Node Feedback
Hover and press states make infrastructure points feel inspectable before selection. The same feedback language is reused across node types to keep interaction predictable.
Sub-structure
Nexus
Regulator
Inactive
Detail Disclosure
Selecting a node moves attention from the map to the detail panel. The selected ring, panel update, and status data appear together so the operator understands which object is being inspected.
Supporting Records
Supporting pages reuse the same interaction logic through card hover states, selected records, and consistent status feedback.
C
Archive System
The map sits inside a wider archive system. Supporting pages extend the same operational language into communication records, habitation data, and incident history.
Archive Home
The map is framed by objective text, live metadata, and archive navigation.

Communion Records
Communication entries are organised as active and discontinued records.


Habitation Zones
Population and infrastructure data are presented as operational records.

Overseer Log
Incidents are tracked through category states and severity feedback.

System Robustness
Mobile Fallback
The mobile version prioritises access to records and static map context rather than recreating the full desktop interaction model.
Mobile Map Fallback
The desktop map is reduced to a static overview on mobile, preserving spatial context while prioritising access to records and navigation.

Habitation View ModesThe habitation page uses simple view states to separate structural imagery from altitude information.

Design Trade-offs
Approach
Map-first interaction model.Diegetic archive language with functional UI structure.Progressive disclosure for dense operational data.
Decisions
Kept the infrastructure map as the primary surface so operators can assess network risk before opening records.Standardised status language across nodes, routes, alerts, cards, and archive pages.Used motion to confirm layer changes, node inspection, and record interaction rather than adding decorative animation.
Trade-offs
Reduced visual contrast in secondary metadata to preserve atmosphere, while keeping critical states colour-coded.Prioritised desktop interaction for the full map system, with mobile acting as a simplified fallback.Avoided adding deeper filters and extra interaction states where they would increase complexity.
Outcomes & Reflection
Outcome
Skycross became a coherent monitoring system rather than a collection of atmospheric screens.
The final interface connects map interaction, status logic, archive records, and motion feedback into one consistent operator experience.
Future Improvements
Validate the map interaction with external users to test whether the layer system, node states, and archive navigation are immediately understood.Improve mobile by designing a more purpose-built archive experience rather than relying on a simplified fallback.Refine performance for heavier motion states, especially animated fauna activity.
Reflection
This project pushed me to design beyond isolated screens. I had to think in interaction states, hierarchy, accessibility, motion behaviour, and system consistency.
The strongest lesson was learning where atmosphere supports usability, and where it needs to be restrained.